Yesterday, Microsoft announced a new version of Insider Preview build for Windows 10. The build version is 19546, and the unique thing it has is a new Graphing Mode in Windows Calculator. Microsoft says Graphing Mode in Windows Calculator is one of the most requested features they receive in their feedback hub.
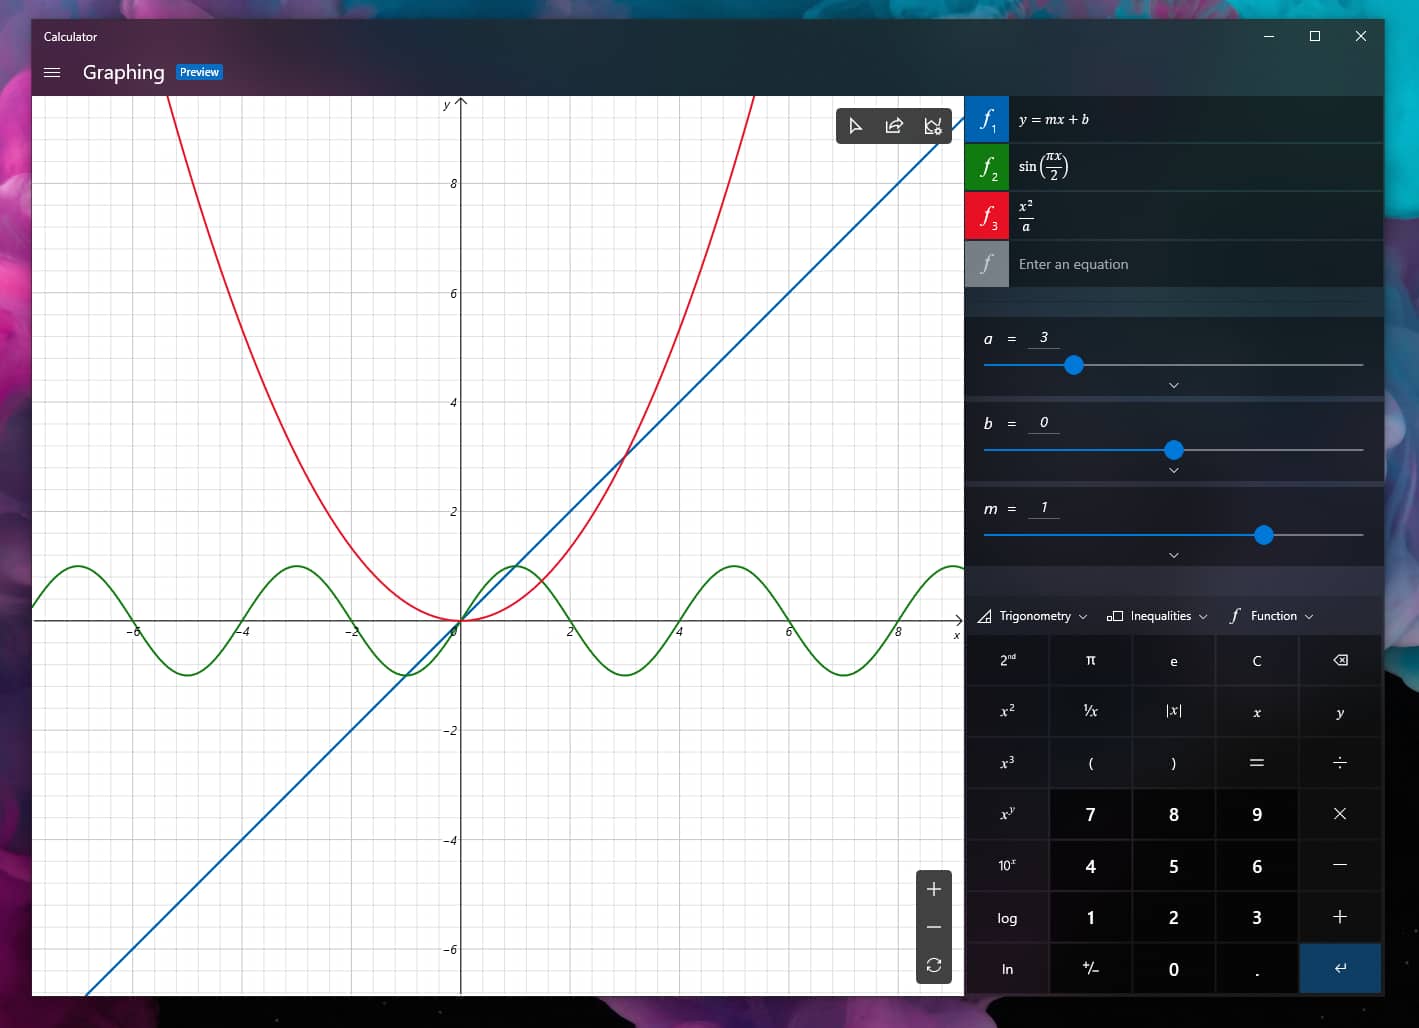
With this new Graphic Mode, users can now explore linear algebra is detail. For example, users can plot multiple equations at the same time to compare their plots against each other. They can also enter an equation with a secondary variable and can manipulate the variable to see how the graph changes accordingly.

In the new Graphing mode, users can also use their mouse and keyboard to trace plots to understand the relationship between the variable and the equation better.
The Graphing mode also has options to customize the line style as well as the Graphing Window to give users the custom viewing experience.
Although Microsoft has brought this feature in Insider build version 19546, it not sure whether it packs in a stable release.
Read also: Wipro and IISc Build India’s First Metal 3D Printing Machine