

Check the numbers first
Build an interactive dashboard with Gemini in Google Sheets. Test filters and totals, then check access before sharing.
Key Takeaways
- Put the fields you want to use on one sheet tab. Work with a sample or a copy first.
- Open the sheet on a computer and use Create a canvas if your account offers it.
- Ask for a total and a filter you can test. Compare the results with the cells in the sheet.
- Check what the canvas shows before you share. A public view can expose data from the sheet.
To build a Google Sheets dashboard with Gemini, start with one tab of clean data. Open the sheet on your computer and select Create a canvas. Ask Gemini to show the totals and filters you need. Check the answer against a sum you can do yourself before you share the result.
Try a small job for your first canvas. You could use a list of sample costs to see how much each category adds to the total. Add one filter so someone can choose a month or type of cost. The goal is to let a reader answer one question without making them scroll through every row.
Check Whether Google Sheets Can Create a Canvas
Google’s Sheets help says canvas needs an eligible Google Workspace or Google AI plan. It lists English support. It also says some people with a personal Google Account may be able to build up to three times a month. The options can depend on the account, so look for the tool on the sheet you plan to use.
Open Sheets on a computer with the file in Google Drive. Google says a phone app, an offline file or a file on other storage may not show canvas. Some file controls can also affect access, such as when the owner turns off download, copy or print. If you are using an Excel file, Google’s help suggests you save it as a Google Sheets file for the Gemini features.
If you have both a work and a personal account, check which one owns the sheet. You cannot assume a feature in one account also appears in the other one. For a work file, follow your team’s rules on using AI with its data. Try your first canvas on a small sample that does not show private names or payment details.
Prepare One Tab for the Google Sheets Dashboard
Google says a canvas uses data from one sheet tab. Put the fields you need together on a separate tab. Use one row per item and one clear name per column. Start with the fields that answer the question you picked. Leave notes, scores or details people should not see on a tab you do not use.
If your task is to see total cost by type, you could use columns for Date, Category and Amount. Put the column names in one row. Keep the amount as a number, with a currency format that fits it. If you keep both U.S. dollars and Indian rupees, choose one currency for the test or add a field so you can filter them. A sum across different currencies gives a figure you can’t use as one cost.
Check for rows that can change the total
Look for old totals that sit in the same list as individual costs. If the dashboard adds them all, it can count some costs twice. Check for blanks and text in a number column. If you put a dash or a note in an amount cell, decide whether it means zero, unknown or something else. Make that choice before you ask the tool to group the rows.
Check one date that is easy to confuse. For example, write the month in words while you inspect the date format, then make sure Sheets sees it as a date. If the date cells use two formats, put them in one format before you ask for a month filter. It is easier to fix that in the data than to look for missing rows in a finished view.
If one cell should be private, don’t hide a column and count on that to keep it out of a canvas. Make a copy that omits the data you do not want to use. Google warns that the canvas can send underlying data to the browser. A file of sample data is a safer place to learn how the display and its access rules work.
Build a Canvas With One Clear Question
Open the sheet and select the tab you want to use. Google’s help lists three ways to start on a computer. You can use Tools then Create canvas in the side panel, Insert then Create a canvas in the menu, or the Canvas menu in the bottom bar. Use whichever option your sheet shows. Confirm the source tab when you set up the view.
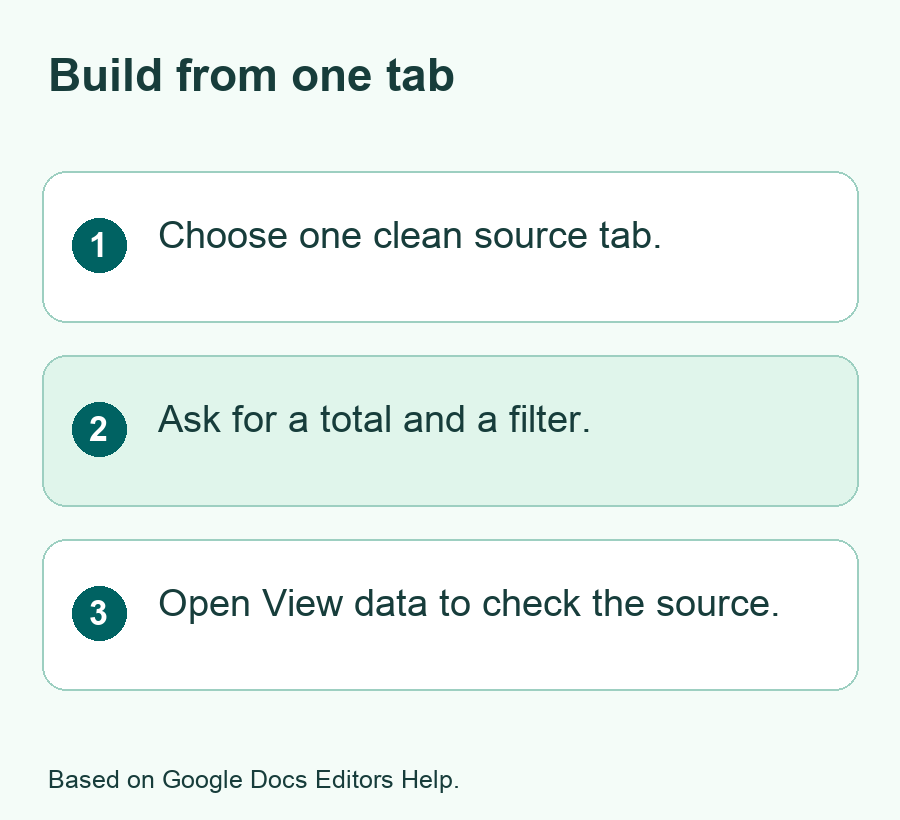
- Open the sheet with the sample data on one tab.
- Choose Create a canvas from a control that appears in your account.
- Tell Gemini the question your view should answer and name the fields it needs.
- Ask for one chart or total and one filter. Review what it builds.
- Open View data and check the source before you use the dashboard.
Here is a sample request. Build a dashboard from the Date, Category and Amount fields on this tab. Show a total by category and let me choose a category to see which rows it includes. Use one currency. Put the total near the top. Leave the rows as they are while I check the result.
Name the labels you want someone to see. A label like Total for selected category is clearer than Total if there is a filter. Ask for the total to update when a person uses that filter if that is what you need. Start with one view. If it works, you can ask for a second chart or a new control after the first check.
Pick a view that fits the task
Use a chart when you need to see how groups compare. Use a short list if the reader needs to find one row. Use a calendar view for dates. Google’s help also lists boards that group items by status. A large view with many small charts can slow down the first task. Keep the first canvas focused so you can see if someone knows what to click.
| Question to answer | Small first view | Test to run |
|---|---|---|
| What did each category cost? | Category totals and one chart | Compare two totals with the sheet |
| What changed this month? | One month filter and a row list | Check which dates the filter includes |
| Which task is due next? | A date view | Check the date and sort order for two rows |
| Where is the bulk of the work? | Status groups and counts | Count a group from the source data |
Check the Dashboard Against a Hand Calculation
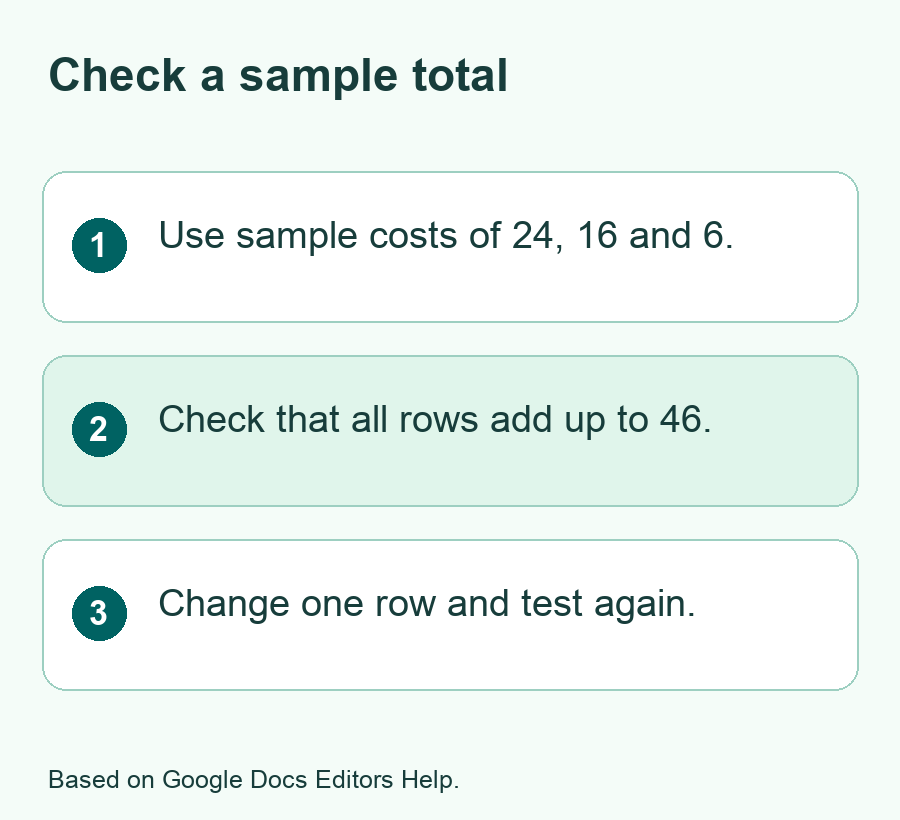
Give the canvas a result you can check in a few seconds. Say you use three sample costs in one currency. Travel is 24, food is 16 and travel is 6. The travel total is 30. Food is 16. The full total is 46. Those are sample numbers to test a method. Keep enough rows to check a filter and few enough that you know the expected answer.
Open the dashboard with every category shown. Check the all-category total. Pick Travel and see whether the total changes to 30. Look at the rows. If Food still appears, find out if the filter applies to the chart only or to both the chart and the list. Ask for clearer labels if two parts of the view use a filter in different ways.
Test one case with no matching rows too. For a month filter, pick a month with no sample data. A zero, empty view and error each tell you something else. Decide what you want the reader to see. If an empty view looks broken, ask for a short message to explain that no rows match the filter.
Test what happens when a row changes
Make a test edit in your copy, such as changing the sample food cost from 16 to 18. The total of all three items should rise from 46 to 48. Check the full view and the Food filter. If the old figure stays in view, check how the canvas reads the source and whether it needs another action to show new data. Follow the help for the feature in your account.
If you want people to update a record from the canvas, try one edit on a row you can tell apart. Open the sheet and check the value there. See which account can make the change. If the view is for readers only, test the link with someone who has the access you mean to give them. Make sure the controls they see fit the job.
Review the source tab when the numbers don’t match
Google says you can open View data on the canvas. Follow that route if the result looks wrong. Check the tab, the columns and the rows. Look for a total row that was added again. Look at cells that contain currency symbols as text. If an amount is missing, check its source value before you change the chart.
Fix one thing at a time. Correct a row in the test data or clarify the request and then run the same checks. If you ask Gemini to edit the canvas, read its changes before you use the new view. If a change touches the source data, open the sheet and check the affected row before you carry on. Keep the original copy until the checks work.
If you keep a total in the sheet as a cross-check, put it outside the rows your canvas reads. Label it with the same currency as the chart. Compare it again after you add a new row.
Choose How the Dashboard Can Be Shared
Share the dashboard only after you know what someone can see. Google’s help says a normal copy link to a canvas uses the sheet’s access. If the people you want to reach already have the right access, try that link with one person. Ask them to open the view, choose one filter and tell you what result they see.
Google also describes a publish option that can set separate access for a canvas. The people who get access may depend on the account and admin policy. Google notes that viewers may be able to access data sent to their browser even when the main sheet is restricted. Use sample or cleared data for a public canvas. Check the data as well as the screen that people can see.
In a work setting, ask who needs the view and what they need from it. If a team only needs monthly totals, give it a view based on totals without all the individual rows. If people need to edit the data, choose the role through the sheet’s own Share controls. Open the link from an account with the role you intend to give before others depend on it.
Leave a note that tells readers what the view shows
Name the date range and currency in the view or a note near it. State whether the chart includes all rows or only the chosen category. Give a clear way to return to all rows if a filter changes the view. For a regular report, put the day you last checked the data near the total so people know how fresh the figures are.
You can save a short check list with the sheet. Note the test rows you used and the expected totals. After a new month or category appears, run the same checks before sharing the view again. If the dashboard is for a one-time job, keep the small source table and the result together so you can explain what someone saw later.
Open the view on the smallest screen your readers use. Check that they can tell which filter is on. Look at the currency and date range next to the result. If the screen feels crowded, move one less useful chart out of the main view. Ask a new reader to find a total without your help. Their first click can show where a label needs work.
Fix a Canvas That You Can’t Build or Use
If Create a canvas does not appear, check the file type, location and account first. Use a Google Sheets file stored in Drive and open it on a computer. Check whether the account offers the feature in English. If the owner restricted copying or printing, use a file you have the right to use with the tool. Do not change someone else’s settings to get the button.
If a large file fails, work on a copy with fewer rows or columns. Google’s help says combined source data over one million cells is not yet supported. For a first dashboard, you can start with a small date range or make a tab of totals. Check that the smaller file still answers the question you set out to solve.
If the app builds the wrong view, describe the expected result in plain words. Say what should happen when you choose a month or category. Include a number from the sample check. A request like Show 30 for Travel on this test and explain which rows are in that sum gives you a direct way to see if the change helped.
Did You Know?
Google says a Sheets canvas can use only one tab as its source. You can use that rule to make a small, clean input for the view. Include the rows you want to show and a few fields that answer the main question. Check the source tab before you test a chart or share the result.
Conclusion
Build a Google Sheets dashboard with Gemini from one clean tab. Ask for a view that answers one question and check it with sample numbers you can add by hand. Try the filters and verify the underlying data. Review the access settings before you share it, and keep a record of the checks you want to run when the data changes.
FAQs
Can I create a Sheets canvas in the mobile app?
Google’s help says the phone app may not offer canvas creation. Open the spreadsheet on a computer in Google Sheets. Check whether Create a canvas appears for your account. If you need to view a finished canvas on a phone, try the shared link and test the controls you need.
Can I build one canvas from data on several tabs?
Google says one canvas can use data from a single sheet tab. Choose the fields you need and make a tab for them. Check that each row still means the same thing after you bring the fields together. Use View data to confirm the source before you read the totals.
Why does the chart total disagree with my sheet?
Check which tab, rows and filters the chart uses. Look for a total row included with the individual amounts. Check if any amount is stored as text or if a blank means unknown. Use a small test with a known sum and change one thing at a time until the figures agree.
Will someone with the canvas link see my source data?
Google says a normal canvas link uses the sheet’s access. It also says viewers of a published canvas may be able to see data sent to their browser. Review every field in the source before you share. Use a clean copy with only the data you want those readers to have.
Should I start with a new spreadsheet or a copy of my main file?
Start with a sample or a copy made for the test. Pick a few rows with totals you know. Check the output and sharing settings with that copy. Then decide which source data you need for the real view. A small input makes it easier to test the link before you send it to others.
